Vector Data
The Pixel Data chapter discusses working directly with pixels, the fundamental, low-level unit of raster graphics. This chapter looks at vector graphics, which represent images as high-level shapes. Scalable Vector Graphics, or svg, is a common XML-based vector graphics format. SVG files look like this:
<?xml version="1.0" encoding="UTF-8" ?>
<svg xmlns="http://www.w3.org/2000/svg" viewBox="0 0 360 144">
    <rect fill="#092" y="89.43" width="360" height="54.57"/>
    <rect fill="#0af" width="360" height="90"/>
    <rect fill="#fff" x="252" y="54" width="36" height="36"/>
    <polygon fill="#f00" points="288 54 270 36 252 54 288 54"/>
</svg>
SVG files are fairly easy to read and write. One way to get started with vector drawing and code is to write SVG directly by hand and then view them in software like Illustrator or Figma. While this works, SVG is more of an interchange format and isn’t really intended for hand coding. In particular, SVG is declarative and doesn’t have the imperative control structures—like if conditionals and for loops—you may be used to using in languages like Javascript.
In this chapter the code examples will use Paper.js, a library for working with vector drawing in Javascript. With Paper.js, you have the full power of Javascript running in a browser and can export SVG files to work with them in other programs.
Felt Board
Compare creating scenes using direct mark making vs. cut-out shapes.
Setup
Divide class into groups. Give some groups felt and scissors and the other group paper and makers.
Create
Groups, 5 minutes
Using only the materials on your group’s table, create a side-view depiction of a car.
Before you begin, consider the elements that will make up your image of the car: wheels, doors, windows.
Share
Individually, 2 minutes
Look around the room at what the other groups have made.
Discussion
Groups, 5 minutes
Class, 5 minutes
- What are the benefits to creating the scene from felt?
- What are the benefits to creating the scene with paper and markers?
- What are the drawbacks to each?
- What qualities emerge from the two approaches?
- How would you approach animating this scene using the tools you were given?
Meaning vs. Form
Vector graphics must be converted to raster graphics—a process called rasterization—in order to be viewed on a pixel-based display. Vector graphics contain all the information necessary to do so, but you can not directly convert from raster images to vector images: In order to do so you would have to make inferences about the meaning implied by the raster image. Form is ambiguous and inferences are just guesses; they may be wrong.
Consider the image below. What would the image look like if the black circle were removed?

 We might infer that a red circle lies behind the black one.
 The red shape might be a crescent instead. Or it could be something else entirely. We don’t know.
 We don’t know if the blue background should continue either.
When we look at the image, we quickly infer that it represents two overlapping circles on a blue rectangle, but the raster image doesn’t contain information about shapes at all. It contains only blue, red, and black pixels. Humans are very, very good at inferring meaning from visual forms. We fill in meaning without conscious thought. When we look at the image above we see the circles automatically.
Humans are so good at inferring visual meaning that it can be difficult for us to separate our inferences from our direct observations. In Stranger in a Strange Land (1961), Robert A. Heinlein explores this idea. One of the book’s characters is a fair witness, a person who has trained themselves to carefully observe and report what they see without drawing inferences.
Anne was on the springboard; she turned her head. Jubal called out, “That house on the hilltop—can you see what color they’ve painted it?”
Anne looked, then answered, “It’s white on this side.”
Jubal went on to Jill: “You see? It doesn’t occur to Anne to infer that the other side is white, too. All the King’s horses couldn’t force her to commit herself…unless she went there and looked—and even then she wouldn’t assume that it stayed white after she left.”
Because we are so good at inferring meaning, meaning is always available to us. Computers are not good at inferring meaning from form. A human can guess that a red circle lies behind the black one, but a computer can’t—so the human can imagine the drawing without the circle, and the computer can’t.
This is the key advantage of vector graphics over raster graphics: vector graphics contain high-level meaning about the image that they represent. They are built from semantic units like rectangles and ellipses instead of nonsemantic pixels. This meaning allows computers to easily make high-level changes: we can scale the vector image up and perfectly fill in the needed additional detail; we can change the fonts used to render text; we can remove a shape and reveal what is behind it.
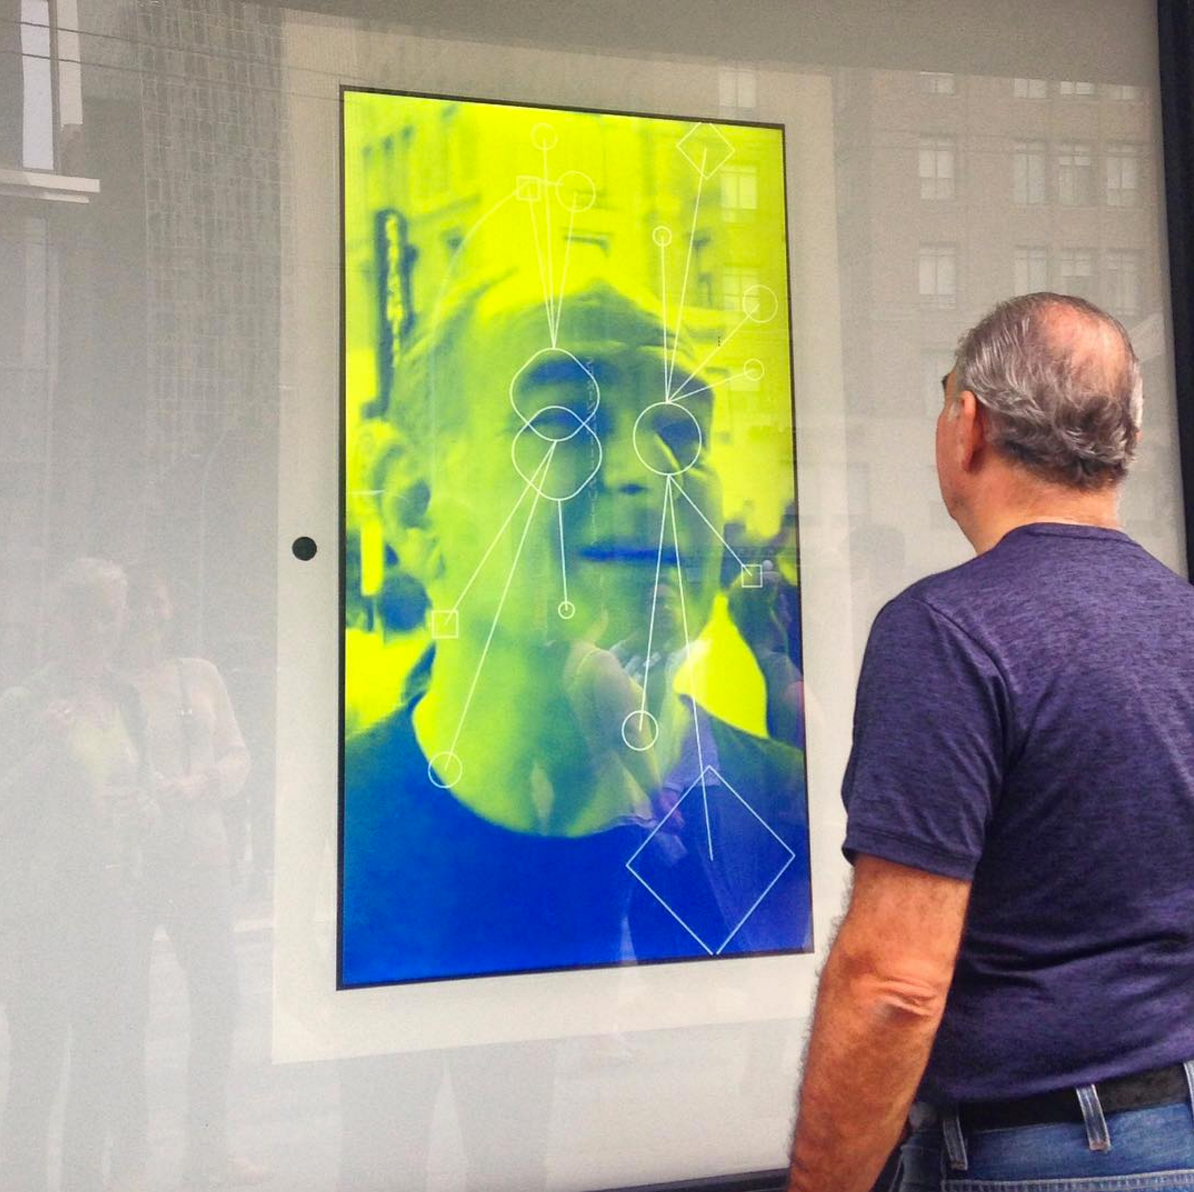
Actually, computers can infer meaning from images, they just need to be programmed to do so. This is an extremely active area of research, and the rate of progress in recent years is staggering. This research is already making its way to consumer tools—Photoshop introduced Content-Aware Fill in 2010. Current approaches are actually better than humans at many specific tasks.
The Two Minute Papers channel on YouTube summarizes graphics and AI research papers. Here are some great videos:
A Hybrid Workflow
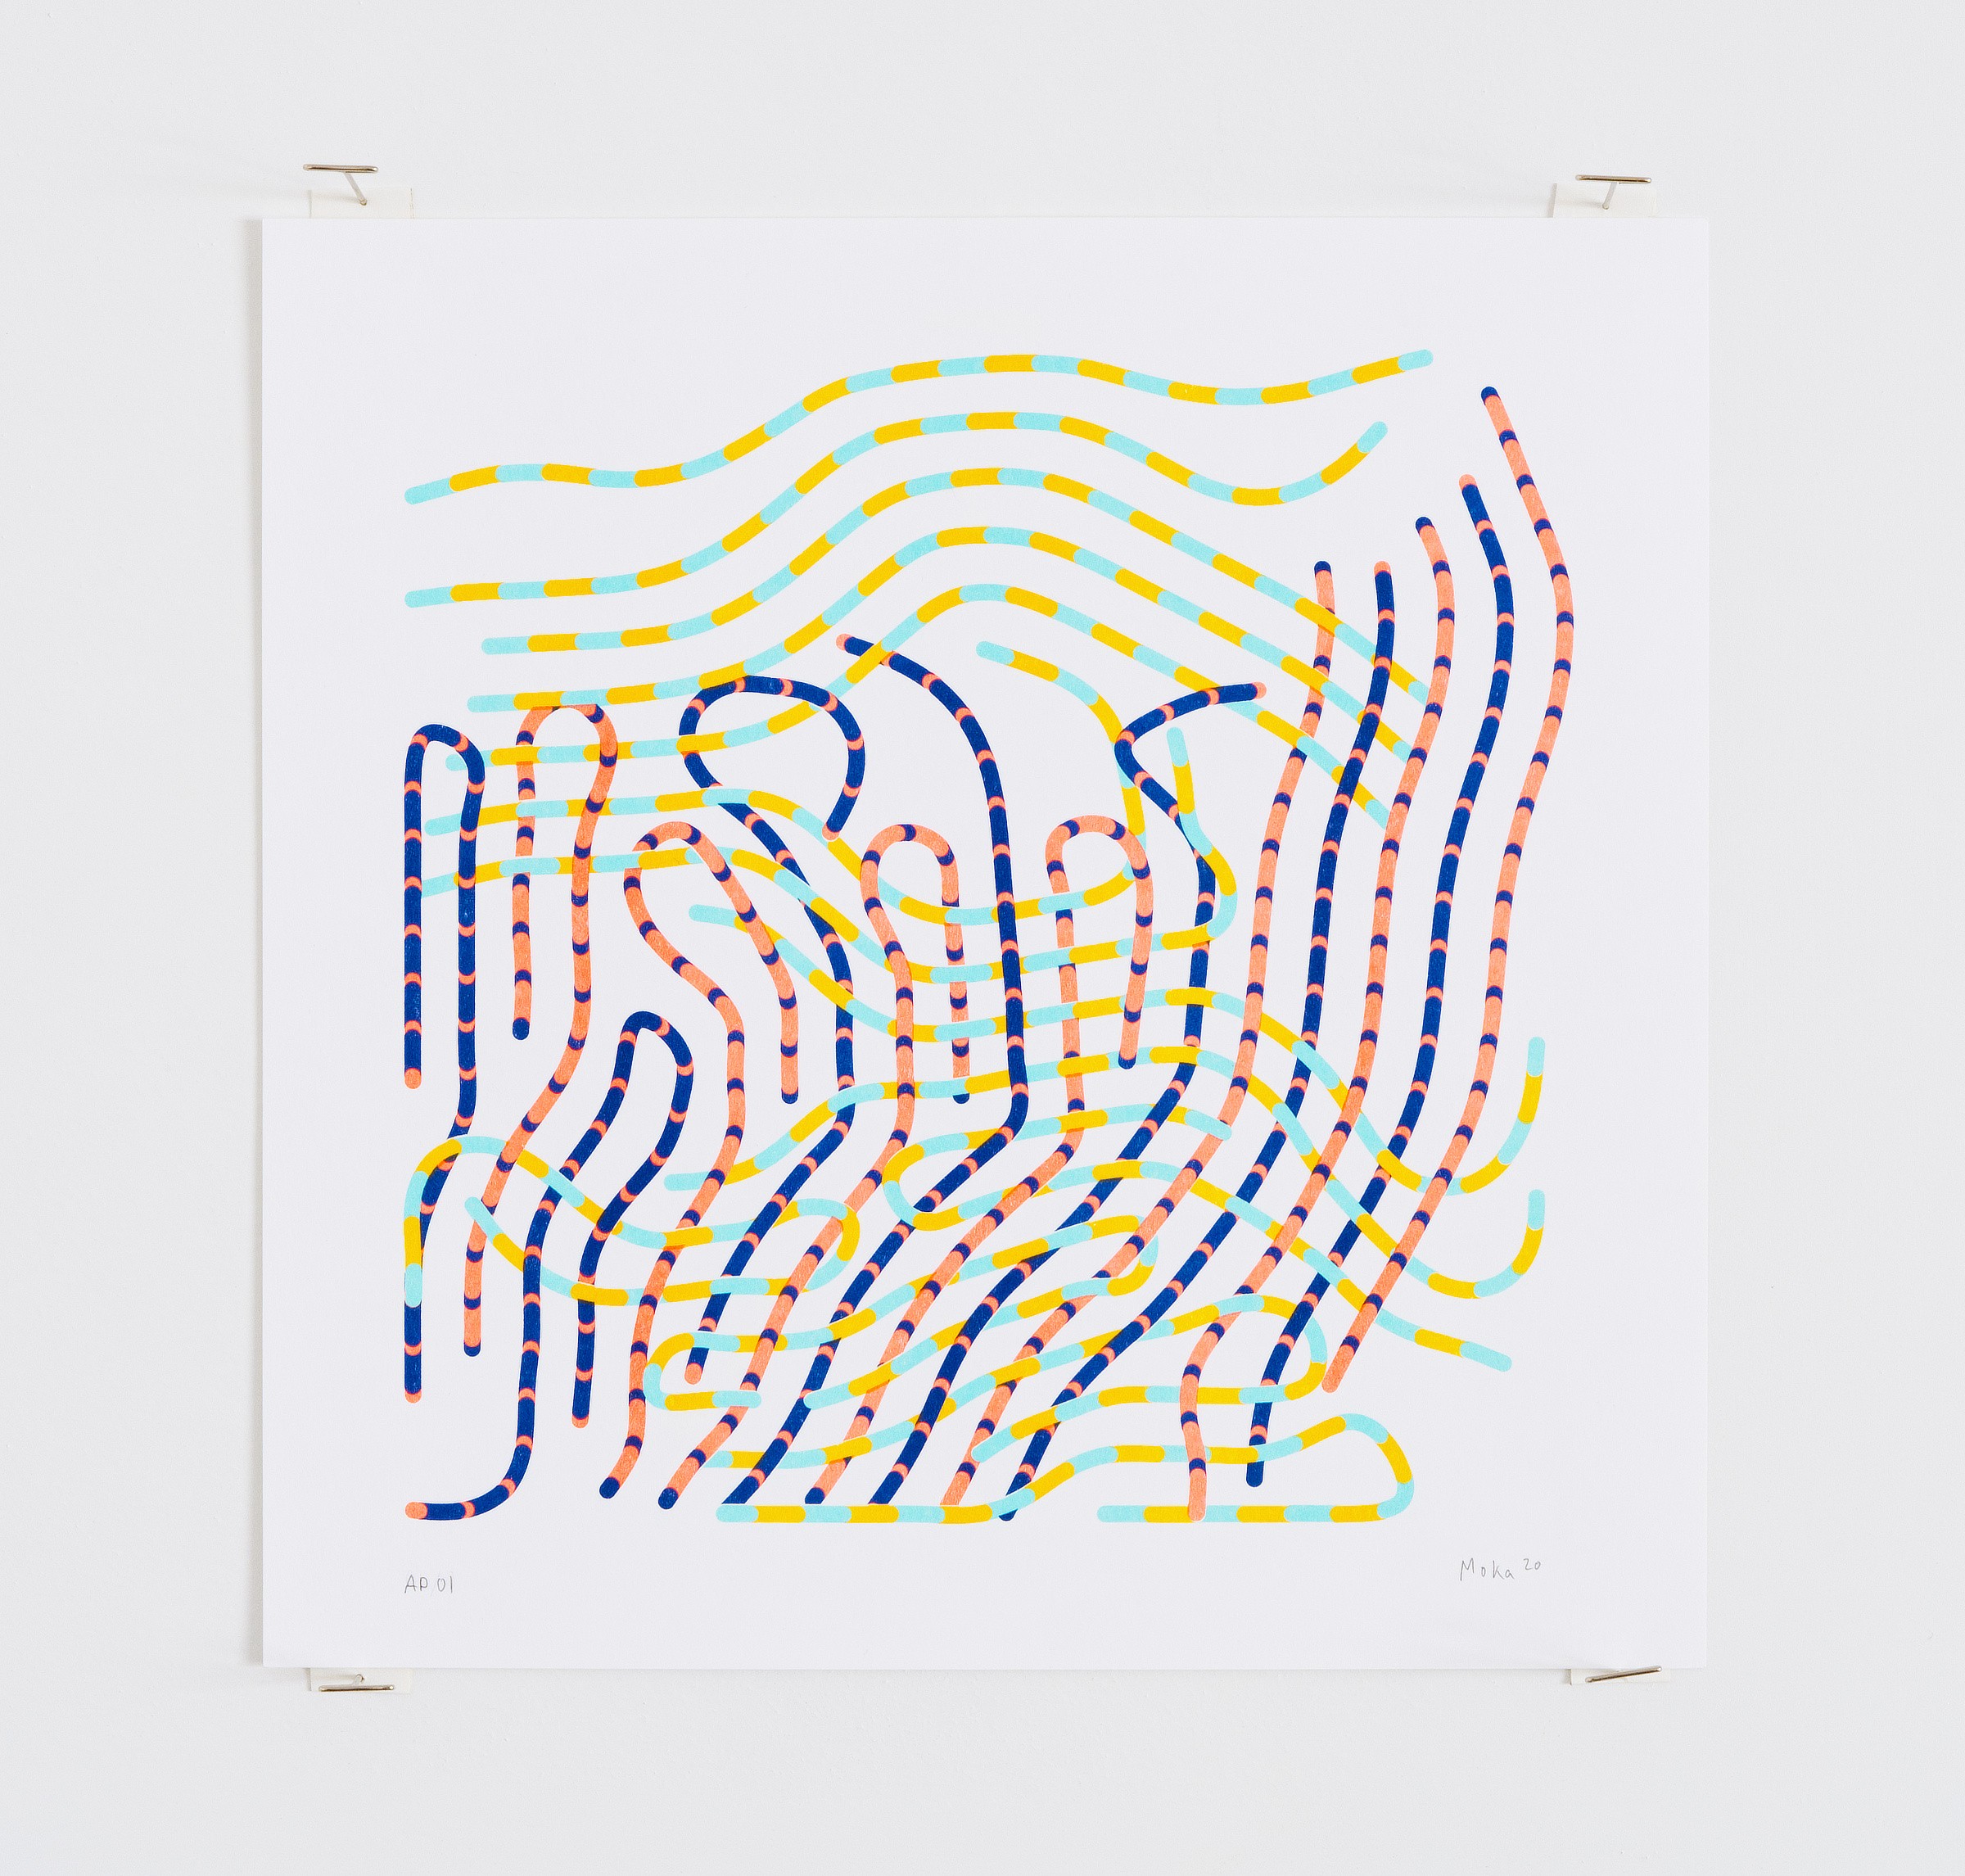
Using a vector-based graphics library allows us to computationally generate images, export them in a way that preserves their high-level shape information, and then further manipulate them in vector editing software.
 Top: Vector Output
Middle: Illustrator » Effect » Stylize » Round Corners…
Bottom: Illustrator » Custom Pattern Brush
Building a workflow like this, that combines custom coding with manual manipulation and prebuilt vector effects, can be a powerful approach to exploring form.
Paper.js
This section introduces Paper.js, a Javascript vector library developed by Jürg Lehni and Jonathan Puckey.
Paper.js is an open source vector graphics scripting framework that runs on top of the HTML5 Canvas. It offers a clean Scene Graph / Document Object Model and a lot of powerful functionality to create and work with vector graphics and bezier curves, all neatly wrapped up in a well designed, consistent and clean programming interface.
You can find an overview of Paper.js features, a set of tutorials, and a complete API Reference on the Paper.js site.
PaperScript vs. JavaScript
Paper.js is a JavaScript library, and can be used with JavaScript directly or with a special version of Javascript called PaperScript. Paper.js is easier to use with PaperScript, at least for small projects. You can find info on setting up your workspace here: Working with Paper.js
You can also use PaperScript with this site’s code example editor. You can tell the editor you are using PaperScript with a special comment: // language paperscript.
Here is an example of a Paper.js program written in PaperScript:
Library Exports
In PaperScript, the library contents are exported to the scope of the program and can be accessed directly. If you use Paper.js with Javascript, you will access the library through the paper object.
PaperScript:
var path = new Path();Javascript:
let path = new paper.Path();Operator Overloads
PaperScript lets you use mathematical operators to work with Point and Size objects. You can see this on line 12 in the example above. circle1Location + new Point(100, 0) adds two points together by adding their components. {x: 10, y:10} + {x:5, y:5} = {x: 15, y:15}. Allowing custom addition procedures for specific types of perators is called operator overloading. JavaScript doesn’t have operator overloading so you’ll have to add each component seperately or use Paper.Point’s add method.
PaperScript:
var point1 = new Point(5, 10);
var point2 = new Point(10, 20);
var result = point1 + point2;
Javascript:
const point1 = new paper.Point(5, 10);
const point2 = new paper.Point(10, 20);
const result = point1.add(point2);
Let and Const Do Not Work in PaperScript
Modern Javascript allows you to declare variables with let and const. PaperScript is based on an older version of Javascript and supports only var.
PaperScript:
var point1 = new Point(5, 10);Javascript:
let point1 = new paper.Point(5, 10);Retained Mode vs. Immediate Mode
The p5.js library is an immediate mode graphics library. When you call rect() or ellipse(), p5.js immediately draws the shape to the canvas.
Paper.js is a retained mode graphics library. When you call Path.Rectangle() or Path.Ellipse(), Paper.js creates object instances to represent those shapes and adds them to a scene graph. The scene graph is editable: you can add, remove, and reorder shapes in the graph and you change their properties. The shapes in the scene graph are all drawn to the canvas at once, when you are done making changes to it.
Creating an animation in p5.js involves constructing and drawing the entire canvas every frame. In contrast, Paper.js redraws the shapes in your scene graph every frame. To create an animation all you have to do is change the properties of your already existing shapes.
Notice that we don’t need to create the rectangle or the ellipse in every onFrame() call. They are created only once before the animation begins. We also don’t need to set the color of the circle every frame. We can set it just when it changes, and that information is also stored in the scene graph.
SVG Output
Since Paper.js works in retained mode and stores your drawing as a vector scene graph, you can export your scene as an svg drawing that you can open in a vector editor like Adobe Illustrator.
The Project.exportSVG() function will create an svg representation of your project as a string. You need to do a little more work to download this data as a file. You can use the downloadAsSVG() in the example below to export your sketches. To export the example click it to focus it, and then press the s key to download the export.
Study Examples
Basics
This pretty minimal example shows the basics of drawing lines with Paper.js. It shows how to create and configure a path object, and how to add points to the path with moveTo and lineTo.
Boolean Operations
A super-useful feature of Paper.js is the ability to combine shapes with boolean operations. This allows you to describe complex shapes by building them from primitives.
Coding Challenges
Explore this chapter’s example code by completing the following challenges.
Modify the Basic Example
- Make both lines 8 pixels wide and blue.
• - Set the
.strokeCapof both lines toround.• - Make 50 lines with random start and end points.
You don’t have the p5.jsrandom()function in Paper.js, but you do have JavaScript’sMath.random(). This will get you a random value between 0 and 500:Math.random() * 500.•• - Make each of the 50 lines a random width and color.
••
Modify the Boolean Example
- Make the green square 500 pixels wide.
• - Change the function that creates comboPath from
subtracttounite.• - Change the function again. This time try
intersect.• - Change the green square to an ellipse.
•• - Remove the green and red shapes, leaving only the compound shape. Tip:
.remove()docs.•••
Create from Scratch
- Draw a simple stick figure.
• - Create a compound shape from three shapes using any of the boolean operations:
unite,intersect,subtract. Tip: You’ll need to do this in two steps.•• - Create the drawing below.
•••
Project Case Study: Paper Garden
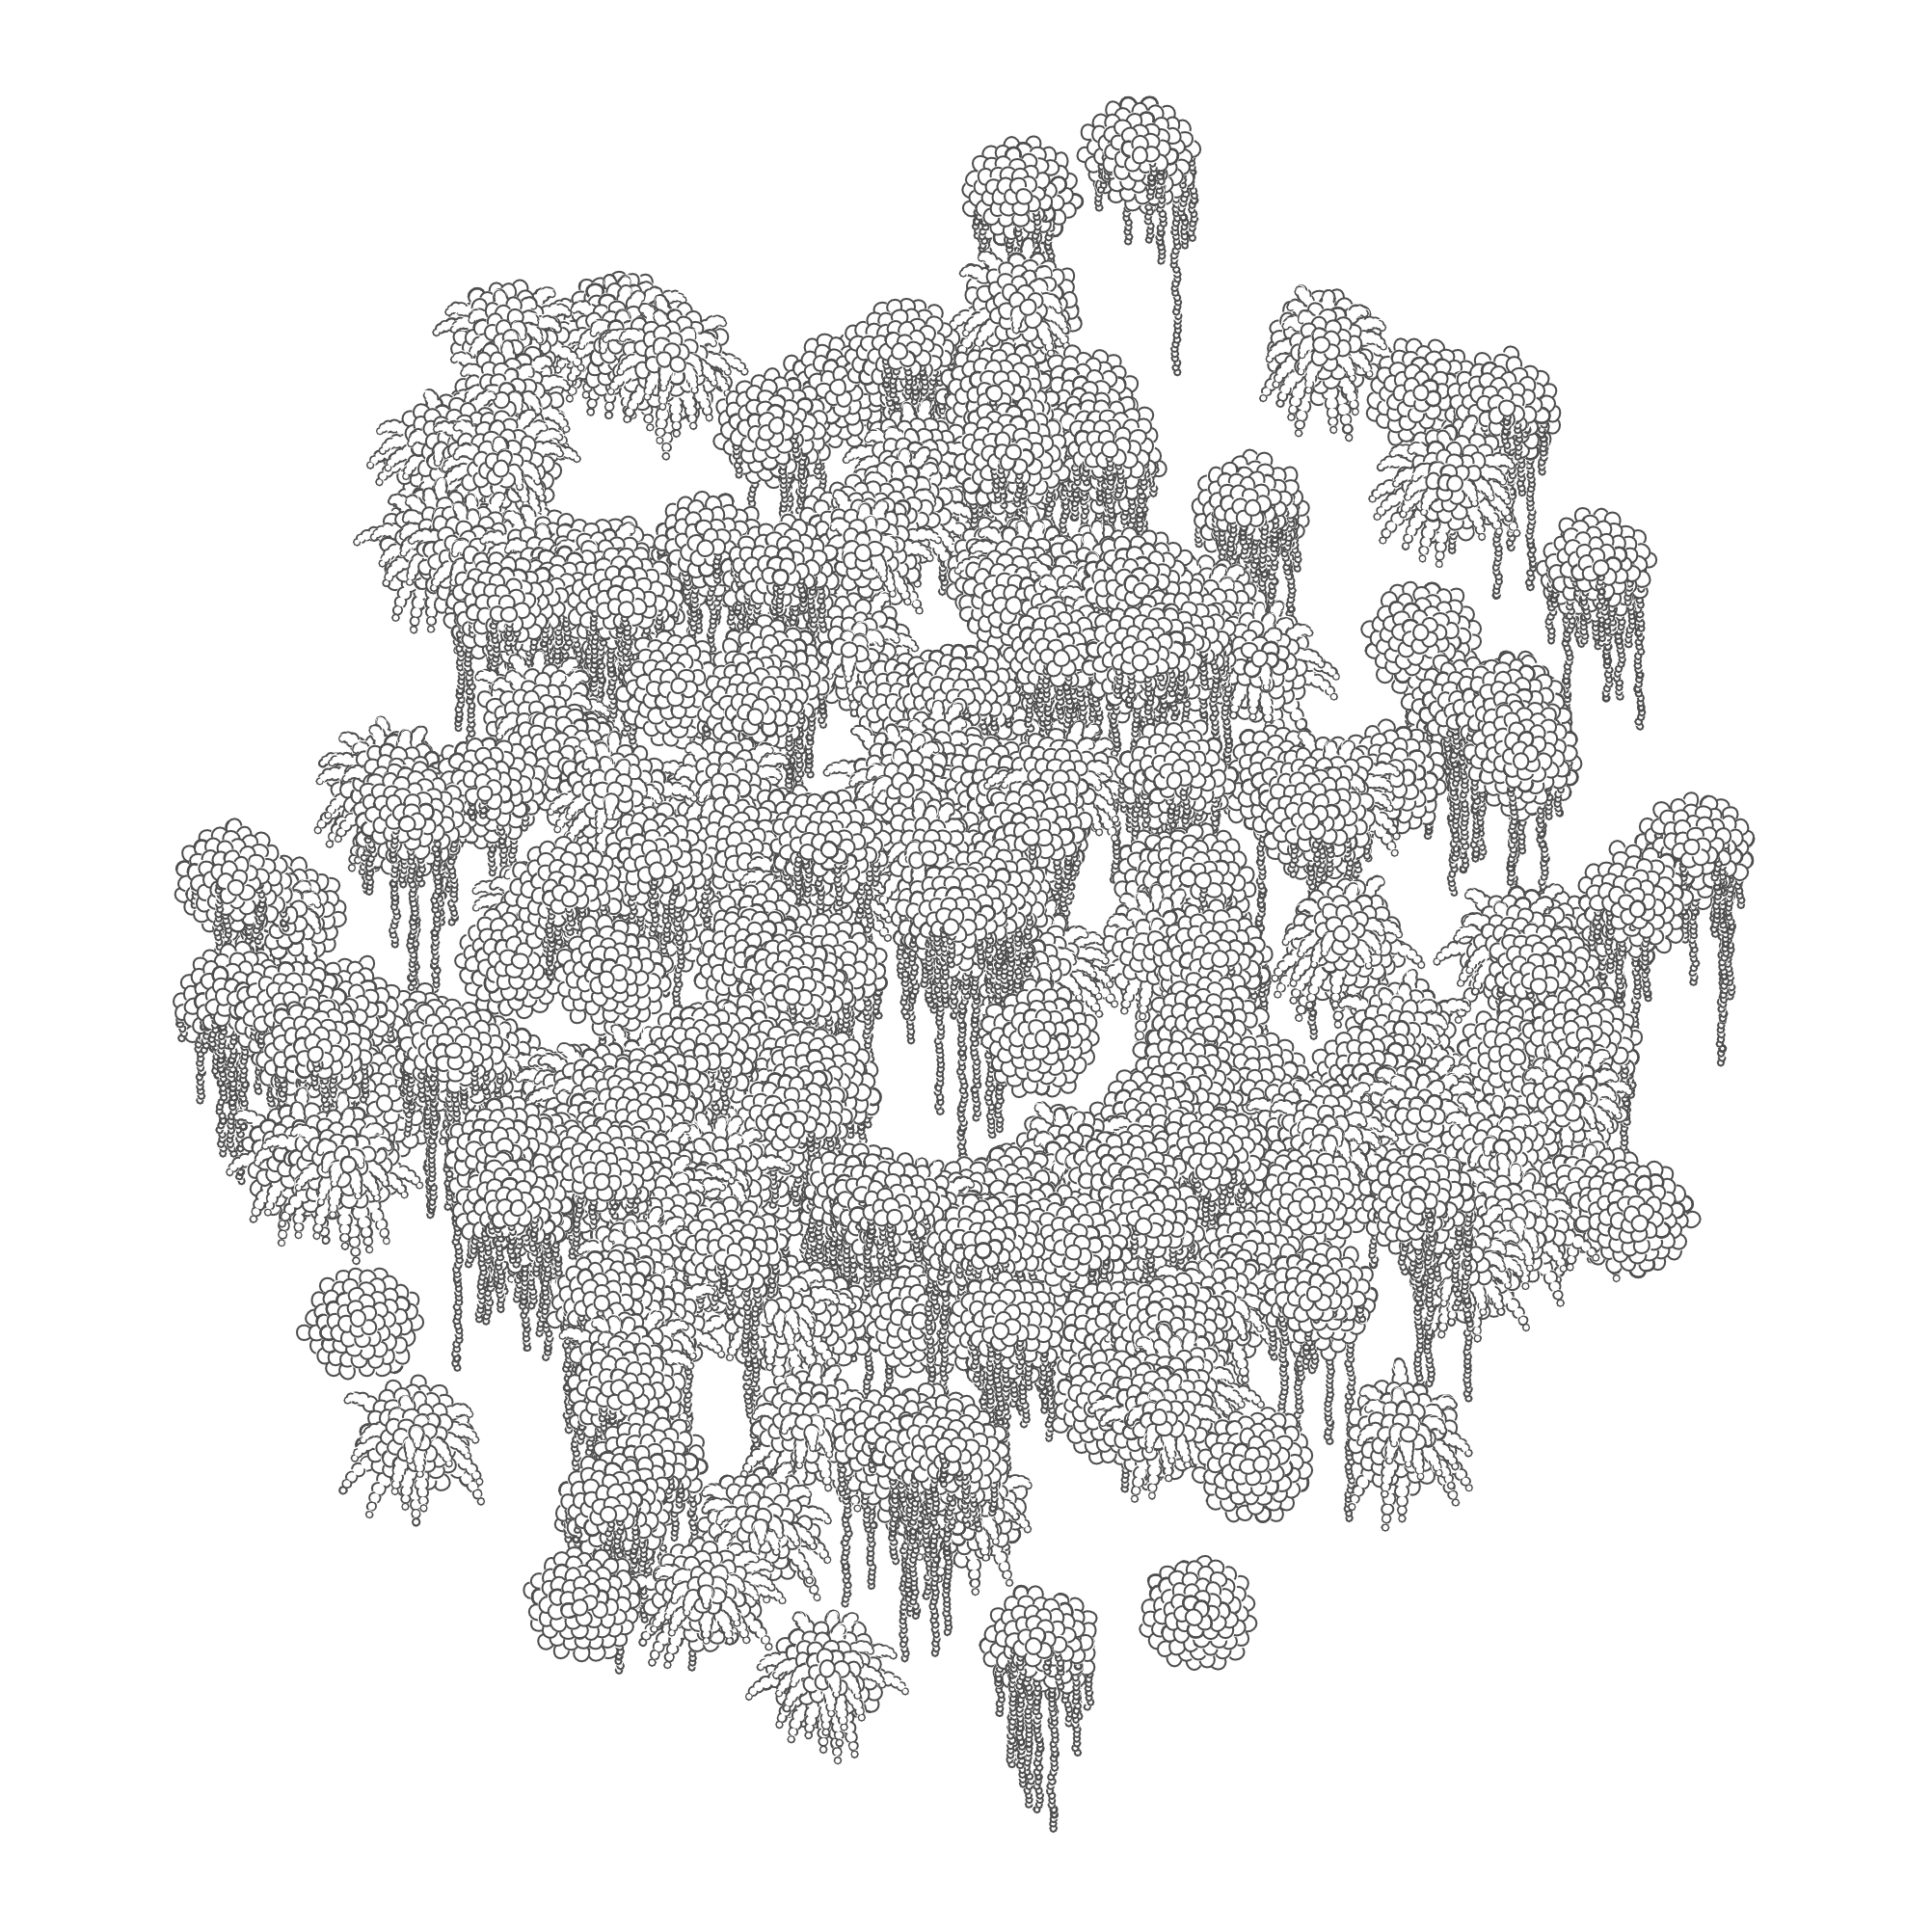
Paper Garden is a program that generates stylized drawings of plants arranged in a wall garden. It is writen in about 300 lines of PaperScript using Paper.js. Read the case study to learn about how this program works and explore the code.
Keep Sketching!
Sketch
Explore using Paper.js. Consider using a hybrid workflow: start with code and Paper.js, export as SVG, and then work manually in vector illustration software.
Challenge: Laser Cut or Pen Plot
Displaying vector art on a pixel-based display, inkjet printer, or laser printer requires rasterization. It is possible, however, to display vector art without rasterizing using a laser cutter or pen plotter. Explore these tools in combination with creative coding by creating a laser cut or pen plotted design in paper.js.
Pair Challenge: Vector Swap
- Create a PaperScript program that outputs vector data.
- Post an image of the output.
- Swap your vector data with another person.
- Manipulate the vector data in a vector tool like Illustrator.
Explore
Autodraw Google A Google AI experiment that interprets sketches, using Paper.js for the draw area.
Variable Fonts Collection Experiment with OpenType customizable typefaces.